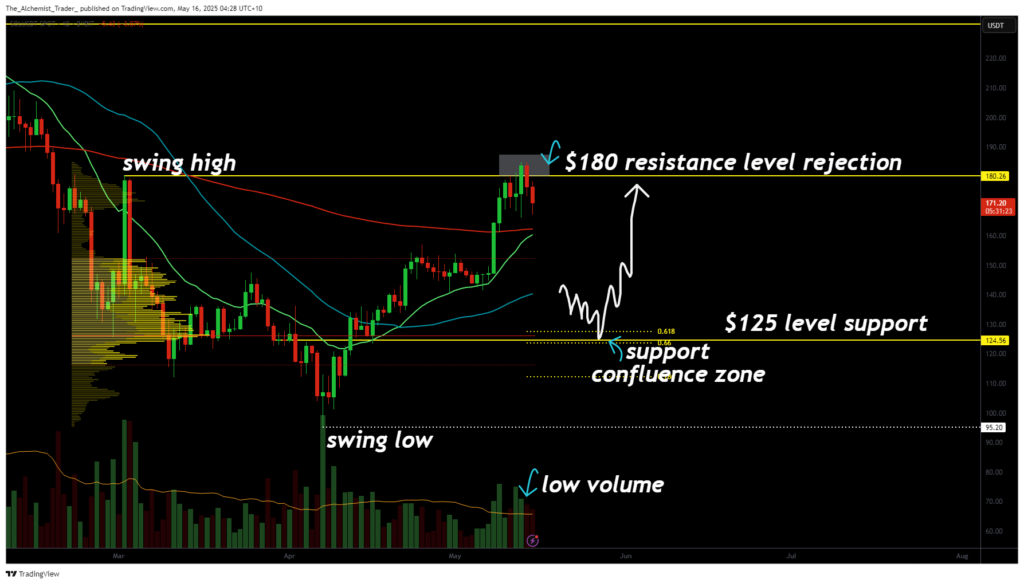
Solana has shown a potential deviation at the key $180 resistance level, with price briefly closing above before quickly falling back below. This signals a likely rotation toward major support near $125 if the level fails to be reclaimed.
Solana (SOL)is at a critical juncture after encountering strong resistance at the $180 level. Recent price action reveals a deviation pattern where the price temporarily closed above $180 but was unable to sustain the move and promptly fell back below. This type of behavior suggests sellers are aggressively defending the level, raising the likelihood of a retracement toward lower support zones.
Key technical points
- Resistance Deviation: Price action showed a counter candle close above $180, followed by a close below, confirming a rejection at this resistance.
- Support Zone: $125 represents a major macro daily support level that acts as a technical high or low on the longer-term trend.
- Moving Average Watch: The 200-day moving average is a critical level; losing it would increase the likelihood of further downside momentum.

The recent price action near $180 is a textbook example of a deviation, where an initial bullish close above resistance is immediately reversed by selling pressure. This signals that bulls are struggling to break through, and $180 remains a firm ceiling. If this level is not reclaimed decisively, the probability of a deeper pullback increases.
The next major area to watch is the $125 support zone. This level holds significant technical weight, as it coincides with prior macro support on the daily timeframe. Traders often consider such zones strong entry points, anticipating a bounce or reversal following a healthy correction within an overall bullish structure. This reflects the concept of “bullish selling,” where pullbacks into support are seen as part of a sustained uptrend.
In addition, the 200-day moving average is acting as dynamic support. A breakdown below this level would signal a shift in momentum and likely accelerate downside pressure toward $125.
What to expect in the coming price action
For now, Solana remains under pressure at the $180 resistance and has not yet reclaimed the level. If $180 continues to hold as resistance and Solana breaks below the 200-day moving average, expect a rotation toward the $125 support zone.
This potential dip may offer a high-probability long opportunity, setting up a trade from $125 back toward $231. On the flip side, a strong reclaim of $180, especially on high volume, would invalidate the bearish scenario and re-establish bullish momentum. Traders should closely monitor volume trends and moving average levels for confirmation.
